Most supplier relationships are managed by impression. The supplier seems reliable. Deliveries usually arrive on time. Quality is generally okay. When a problem occurs, it feels like an exception rather than a pattern.
Four tracked numbers change that entirely. A supplier whose on-time delivery rate is 78 percent is not mostly reliable. They are late roughly one in five times. That is a fact that a spreadsheet reveals and an impression hides.
Why Tracking Matters Even for Small Businesses
Supplier performance data gives you three things you cannot have without it: an objective basis for supplier conversations, an early warning when a supplier is declining before a failure happens, and evidence when you need to justify switching suppliers or negotiating better terms.
You cannot manage what you do not measure. A supplier you have never scored can always claim they are performing well. A supplier whose on-time delivery rate is tracked cannot.
4 Numbers to Track Per Supplier
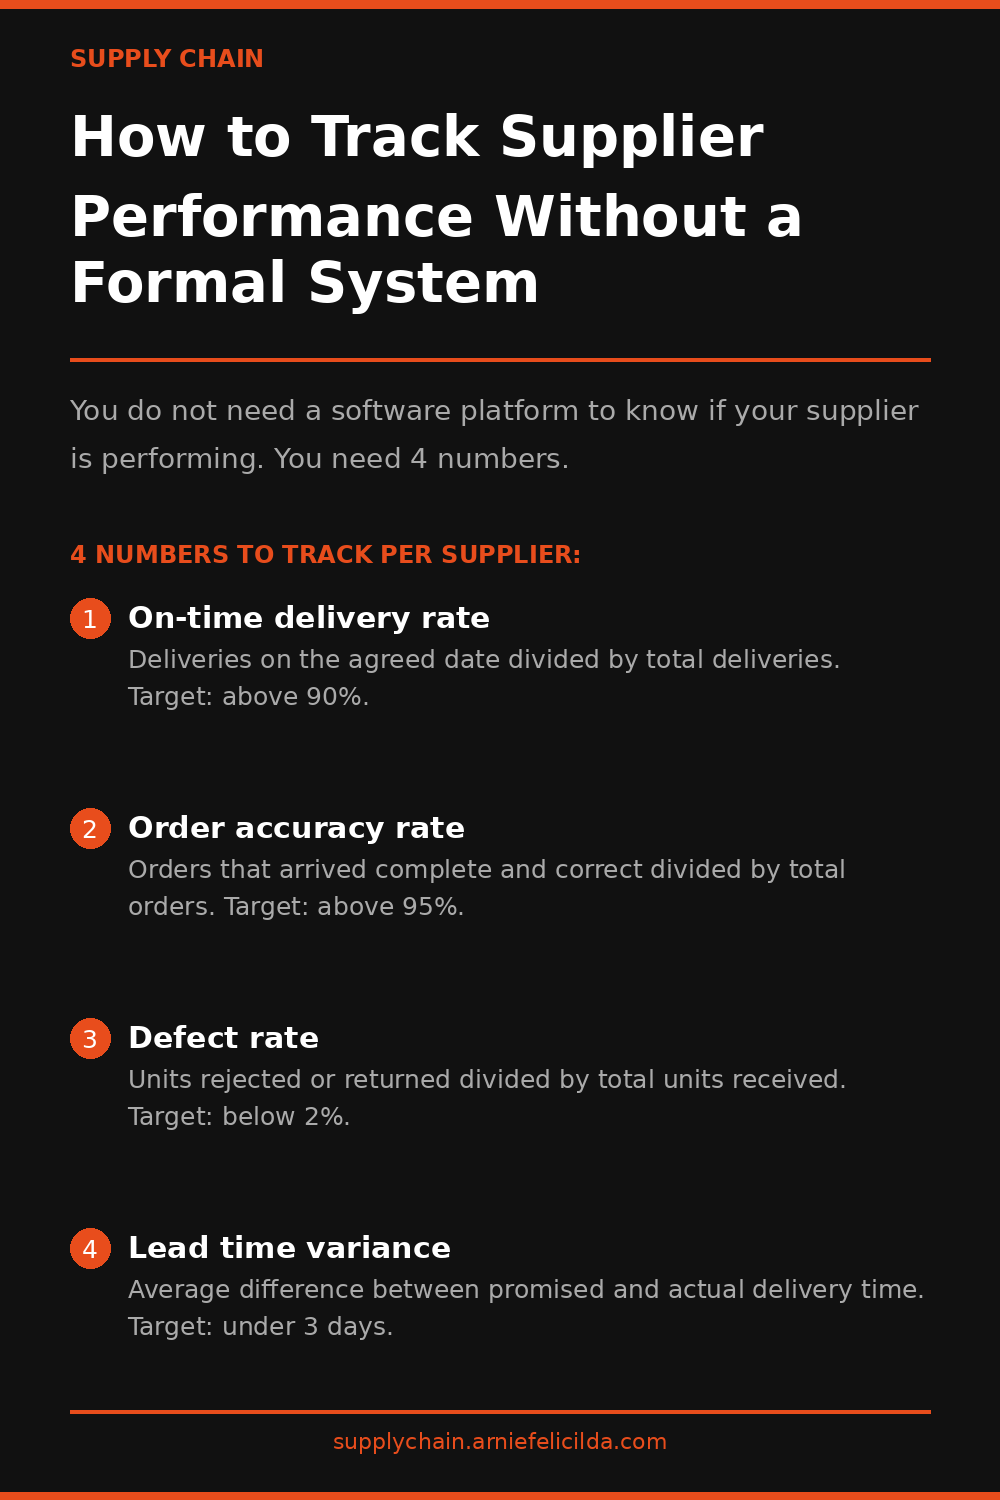
On-Time Delivery Rate
The number of deliveries that arrived on or before the agreed delivery date divided by total deliveries in the period. Calculate this quarterly. A rate above 90 percent is acceptable for most businesses. Below 90 percent means roughly one in ten orders will be late - which may be acceptable or unacceptable depending on your buffer.
Order Accuracy Rate
The number of orders that arrived complete and correct - right product, right quantity, right specification - divided by total orders. An order with a missing item or an incorrect specification counts as inaccurate. Target above 95 percent. Below that threshold, errors are frequent enough to require a process change.
Defect Rate
The number of units that were rejected or returned due to quality issues divided by total units received. Track this per shipment and cumulatively per supplier. A defect rate above 2 percent signals a quality problem that needs a formal conversation with the supplier.
Lead Time Variance
The average difference between the supplier's promised delivery date and their actual delivery date over the last quarter. A supplier who promises 14 days but consistently delivers in 18 has a lead time variance of 4 days. That 4 days needs to be built into your reorder calculations, not assumed away.
How to Use the Data
Review each supplier's four numbers at the end of every quarter. Any metric outside the acceptable range gets a conversation. Not an accusation - a conversation. Share the data. Ask what changed. Give the supplier a quarter to improve before taking further action.
A supplier who improves after a data-backed conversation is more valuable than the conversation cost. A supplier who does not improve is telling you something about their capacity or their priorities that the data makes visible before a crisis does.
For more on this topic, read How to Find a Reliable Supplier for Your Business. You may also find How to Build a Backup Supplier Plan useful for the next step.
Coming Soon - SCM Book 01
The Resilient Supply Chain
Supplier relationships, risk planning, and operational continuity for managers who cannot afford a disruption. Join the waitlist to be first when it drops.
Join the Waitlist