The number on your purchase order is not what your inventory costs you. It is the starting price. By the time that product sits on your shelf, gets counted, insured, stored, and eventually sold, the real cost is 20 to 40 percent higher than what you paid for it.
Most operations managers know their purchase price down to the cent. Almost none can tell you their true inventory cost. That gap between what you think you are spending and what you are actually spending is the hidden drain that makes cash flow feel tighter than your sales numbers suggest it should be.
What True Inventory Cost Actually Includes
True inventory cost is the total cost of acquiring, holding, and managing a unit of inventory from the moment you order it to the moment it is sold. It is not the unit price. It is not the unit price plus shipping. It is every cost incurred between the moment your supplier ships and the moment the item reaches your inventory, accounted and ready.
Cost 01
Purchase Price
What you paid the supplier per unit
Cost 02
Freight and Landed Cost
Shipping, duties, customs, and handling. Often 10 to 25 percent of unit price.
Cost 03
Storage and Warehousing
Allocated warehouse cost per SKU per month
Cost 04
Capital and Opportunity Cost
The return you could have earned on that money elsewhere. Typically 8 to 12 percent annually.
Cost 05
Insurance and Risk
Coverage cost allocated to your average inventory value
Cost 06
Obsolescence and Shrinkage
Estimated annual write-off as a percentage of total inventory value
A Worked Example: The Real Number
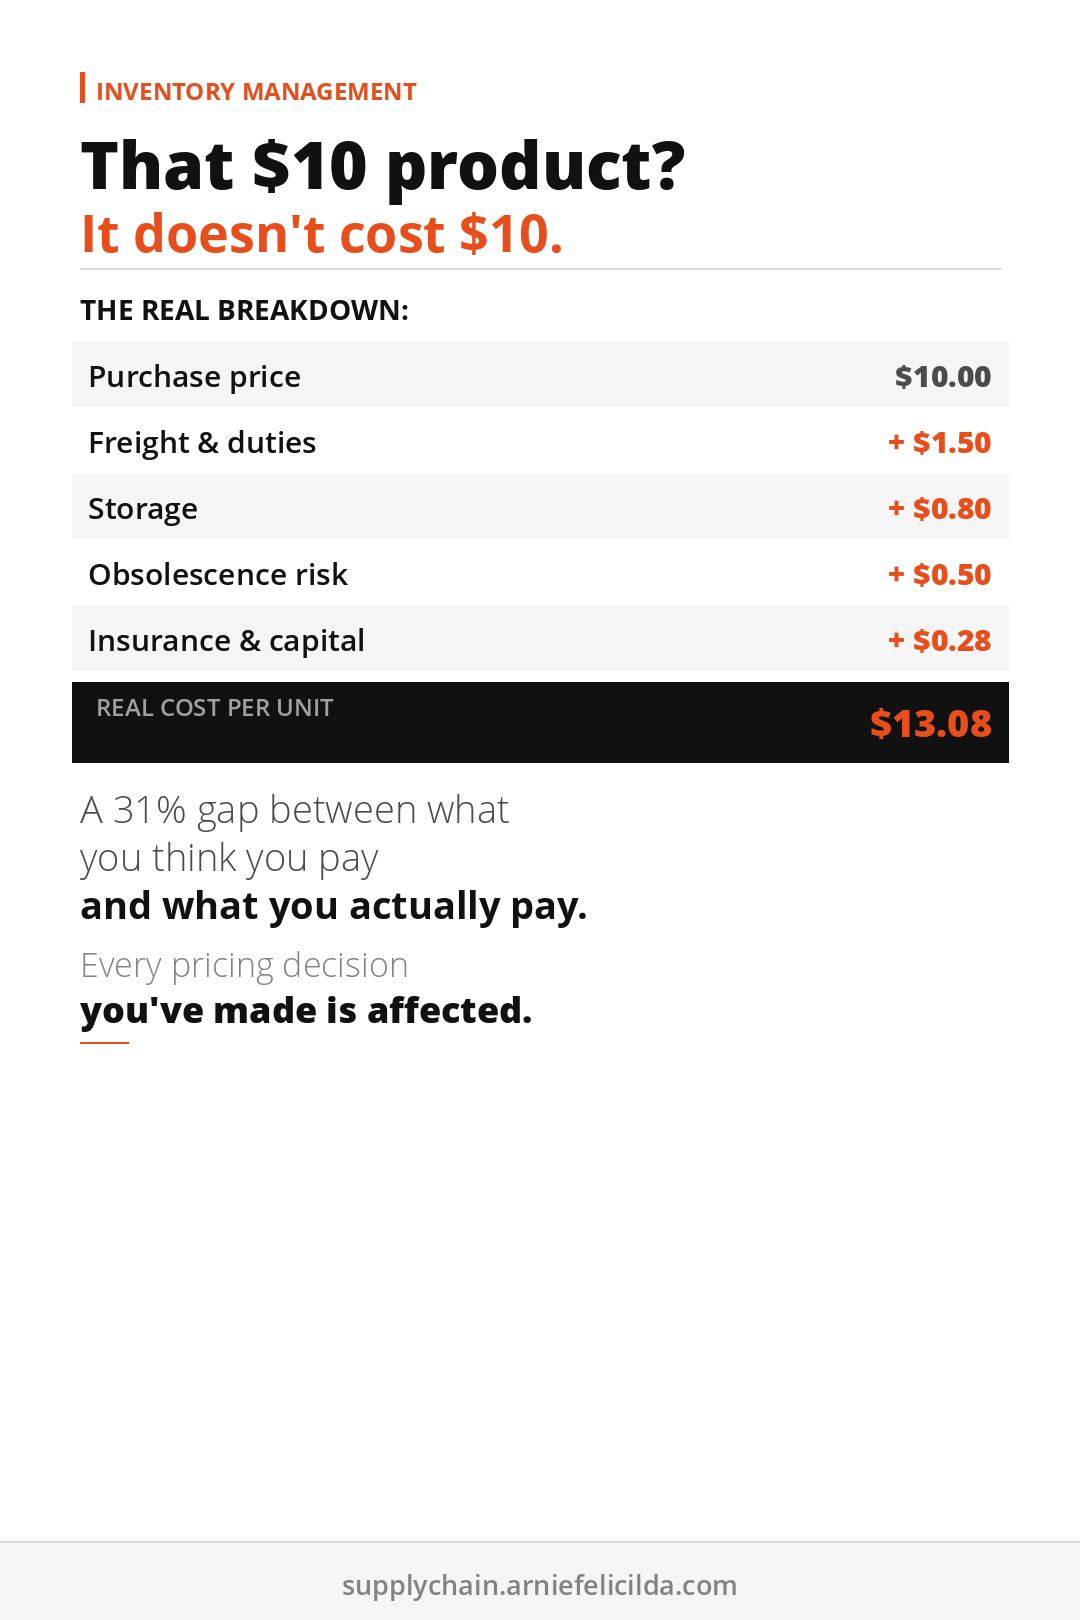
Take a product with a unit purchase price of $10.00. Here is what the true cost looks like once all components are included:
- Purchase price: $10.00
- Freight and duties (15%): $1.50
- Warehousing allocation: $0.80
- Capital cost (10% annually, 60-day hold): $0.16
- Insurance allocation: $0.12
- Obsolescence provision (5%): $0.50
True cost per unit: $13.08. That is 31 percent above purchase price.
If you are pricing that product on a $10 cost basis, your margins are 31 percent thinner than you think. If you are making inventory decisions based on a $10 cost, you are systematically underestimating the value of moving that product faster.
On a $100,000 inventory position with a 30 percent true cost markup, you are carrying $30,000 in costs that most managers never see in a single line item. It is spread across rent, insurance, write-offs, and finance costs.
Why Most Managers Never Calculate True Inventory Cost
The honest answer is that most accounting systems are not set up to show it. Purchase price lives in the PO system. Freight lives in logistics. Warehousing lives in facilities. Insurance lives in finance. Obsolescence lives in year-end write-offs.
No single report pulls all six components together for a per-SKU true cost calculation. So most managers work with purchase price and make every subsequent decision on incomplete data.
The fix is not a new software system. It is a calculation you can run in a spreadsheet once a quarter. The Inventory Health Calculator does this automatically.
How True Inventory Cost Changes Your Decisions
Pricing Decisions
If your margins are calculated on purchase price, your actual margins are lower. Knowing true cost gives you an accurate profitability picture by SKU, which items are genuinely profitable and which ones only look profitable before all costs are included.
Ordering Decisions
When you know what it costs to hold inventory, every ordering decision becomes more deliberate. The carrying cost of an extra 60 days of stock is no longer invisible. It is a number you can weigh against the cost of a potential stockout.
Supplier Negotiations
True landed cost is the right number to use when comparing suppliers. A supplier with a lower unit price but longer lead time may have a higher true cost once freight, capital cost, and safety stock requirements are factored in. See the Total Landed Cost Calculator for a complete comparison framework.
SKU Rationalization
When you know the true cost of carrying each SKU, the decision to discontinue low-performers becomes financially clear. A C item with a true carrying cost of $2,000 per year that generates $1,500 in annual gross profit is a loss, even if the purchase price math looks positive.
Calculate your true inventory cost this week. Pick your five highest-volume SKUs. Add up all six cost components. Compare the result to your current pricing and margin assumptions. The gap you find is the number that explains why cash flow feels tighter than your revenue suggests it should.
Also on Pinterest: 📌 You Don't Know Your True Inventory Cost — 5 Costs Hiding in Your Inventory
From the Author
The Accidental Project Manager
How to deliver projects on time without a PMP and cut waste by 11.4% using AI workflows. 15-Minute Daily Sprint System, Scope Lock Framework, and 24 AI Prompts included.
Get the Book →More Supply Chain Reads
- You Don't Know Your True Inventory Cost (And It's Draining Your Cash)
- Why the Cheapest Supplier Is the Most Expensive Decision
Free Supply Chain Tools
Get free supply chain tools. calculators, scorecards, and frameworks.
Built for supply chain managers running inventory, suppliers, and logistics without a manual.