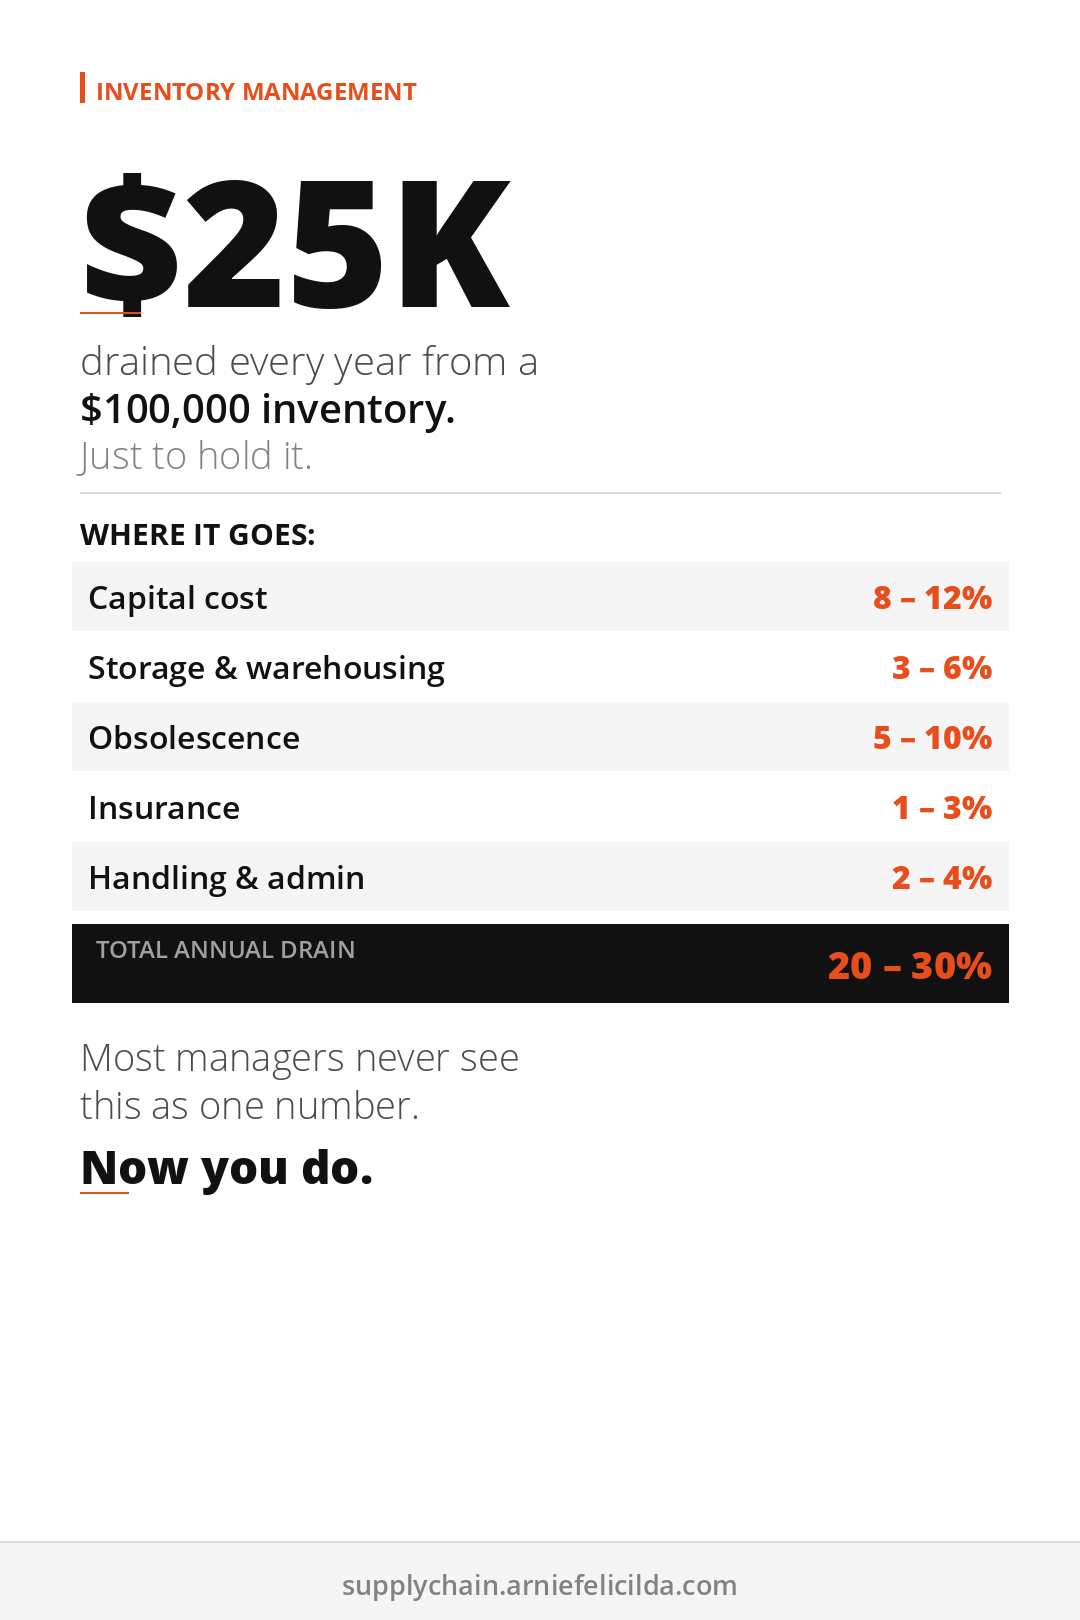
Inventory carrying cost is the total annual cost of holding your inventory, expressed as a percentage of your average inventory value. The industry average is 20 to 30 percent. On a $150,000 inventory position, that is $30,000 to $45,000 per year just to hold it. Most operations managers have never calculated that number. Most of them have felt it, in cash flow that feels tighter than sales suggest it should be, without knowing the source.
This post breaks down every component of inventory carrying cost, shows you how to calculate your own number, and explains what to do once you have it.
Why Inventory Carrying Cost Is the Most Overlooked Number in Operations
Carrying cost is invisible in most financial reports because it is not a single line item. It is spread across five or six different expense categories: warehouse rent, insurance, write-offs, financing costs, and labor. No single report shows it as a consolidated number. So it stays invisible, even as it drains working capital quarter after quarter.
The managers who find it are the ones who go looking for it deliberately. The ones who do not find it keep asking why margins are thinner than expected and why cash flow never quite matches revenue growth.
The benchmark: A carrying cost percentage below 20 percent is well-managed. Between 20 and 25 percent is acceptable for most industries. Above 25 percent signals an overstock problem, a storage efficiency problem, or an obsolescence problem. Often all three at once.
The Five Components of Inventory Carrying Cost
Capital Cost: 8 to 12 Percent
The opportunity cost of money tied up in inventory. If that capital were invested elsewhere or used to pay down debt, it would generate a return. That foregone return is a real cost, even if you own the inventory outright and paid no financing charges.
Storage and Warehousing: 3 to 6 Percent
Rent, utilities, racking infrastructure, warehouse management labor, and equipment costs allocated to your inventory position. If you share space with other operations, allocate proportionally by square footage or pallet positions occupied.
Insurance: 1 to 3 Percent
Inventory insurance premiums scale with the value of what you hold. Most operations have not recalculated whether their coverage accurately reflects current inventory value. They may be over-insured on some categories and under-insured on others.
Obsolescence and Shrinkage: 5 to 10 Percent
Products that expire, go out of season, are damaged, or are lost to theft or counting errors. This is the most variable component and the most controllable. In many product categories it runs 5 to 10 percent of inventory value annually. In perishables, it can exceed 15 percent.
Handling and Administrative Cost: 2 to 4 Percent
Labor cost of receiving, put-away, cycle counting, physical inventory audits, and the administrative time spent managing inventory records. Often underestimated because it is embedded in broader labor costs rather than broken out as an inventory-specific expense.
How to Calculate Your Carrying Cost Percentage
The calculation requires four inputs, all of which you can gather in under an hour from your existing records:
- Average inventory value over the past 12 months (beginning plus ending value, divided by 2)
- Annual warehousing and storage costs allocated to inventory
- Annual insurance cost for inventory coverage
- Annual write-offs, spoilage, and shrinkage from your P&L
Carrying Cost % = (Capital Cost + Storage Cost + Insurance + Obsolescence + Handling) divided by Average Inventory Value, multiplied by 100
For capital cost, use your weighted average cost of capital or a proxy rate of 8 to 10 percent. For handling cost, estimate the percentage of warehouse labor hours spent on inventory management. If the math feels complicated, use the free Inventory Health Calculator, which calculates your carrying cost percentage automatically from your five inputs.
What a High Carrying Cost Actually Means
A carrying cost above 25 percent almost always points to one of three problems.
Slow inventory turnover. When inventory sits longer than it should, every cost component accumulates for a longer period. The fix is faster turns: tighter reorder quantities, better demand forecasting, and an honest review of which SKUs are genuinely moving versus which ones are sitting. Run an ABC analysis to identify where slow turnover is concentrated.
Excess safety stock. Safety stock that was set during a period of high demand volatility and never recalibrated downward is a common source of carrying cost inflation. Review your safety stock levels for your top 20 A items. If lead time variability has decreased or demand has stabilized, your safety stock targets may be significantly higher than current conditions require.
Obsolescence accumulation. Slow-moving inventory does not disappear. It accumulates on shelves until someone makes the decision to write it down. A quarterly review of items with zero sales in the past 90 days, combined with a clear liquidation policy, prevents obsolescence from compounding into a major write-off at year end.
How to Use Carrying Cost to Make Better Ordering Decisions
Once you know your carrying cost percentage, every ordering decision changes. The question is no longer just what does this cost to buy. It is what does this cost to hold, and for how long.
A unit that costs $20 to purchase and sits for 90 days before selling has a carrying cost of approximately $1.00 to $1.50 per unit, based on 20 to 30 percent annual carrying cost prorated for 90 days. That cost does not appear on the purchase order. It shows up in your working capital as money that could have been deployed elsewhere but was not.
Build carrying cost into your economic order quantity calculation. The optimal order size is not the one that minimizes purchase price. It is the one that balances ordering cost against holding cost. More frequent, smaller orders often produce a lower total cost than larger, less frequent orders once carrying cost is factored in.
For a complete picture of what inventory is actually costing your business, read You Don't Know Your True Inventory Cost, which covers purchase price, landed cost, and carrying cost together as a single framework.
Calculate your carrying cost percentage this week. One number. That single figure will reframe how you think about reorder quantities, safety stock levels, and SKU rationalization. And it will explain, finally, where the cash is going.
Also on Pinterest: 📌 Inventory Carrying Cost Calculator — What It Actually Costs to Hold Stock
From the Author
The Accidental Project Manager
How to deliver projects on time without a PMP and cut waste by 11.4% using AI workflows. 15-Minute Daily Sprint System, Scope Lock Framework, and 24 AI Prompts included.
Get the Book →More Supply Chain Reads
- You Don't Know Your True Inventory Cost (And It's Draining Your Cash)
- Why the Cheapest Supplier Is the Most Expensive Decision
Free Supply Chain Tools
Get free supply chain tools. calculators, scorecards, and frameworks.
Built for supply chain managers running inventory, suppliers, and logistics without a manual.