Most operations managers track the wrong inventory numbers. They watch purchase price, total units, and reorder dates. They miss the five inventory metrics that connect directly to cash flow, stockout prevention, and supply chain health.
Working from those three numbers alone means making decisions on incomplete data. Stockouts happen. Overstock accumulates. Cash flow tightens. None of it shows clearly until it is already a problem.
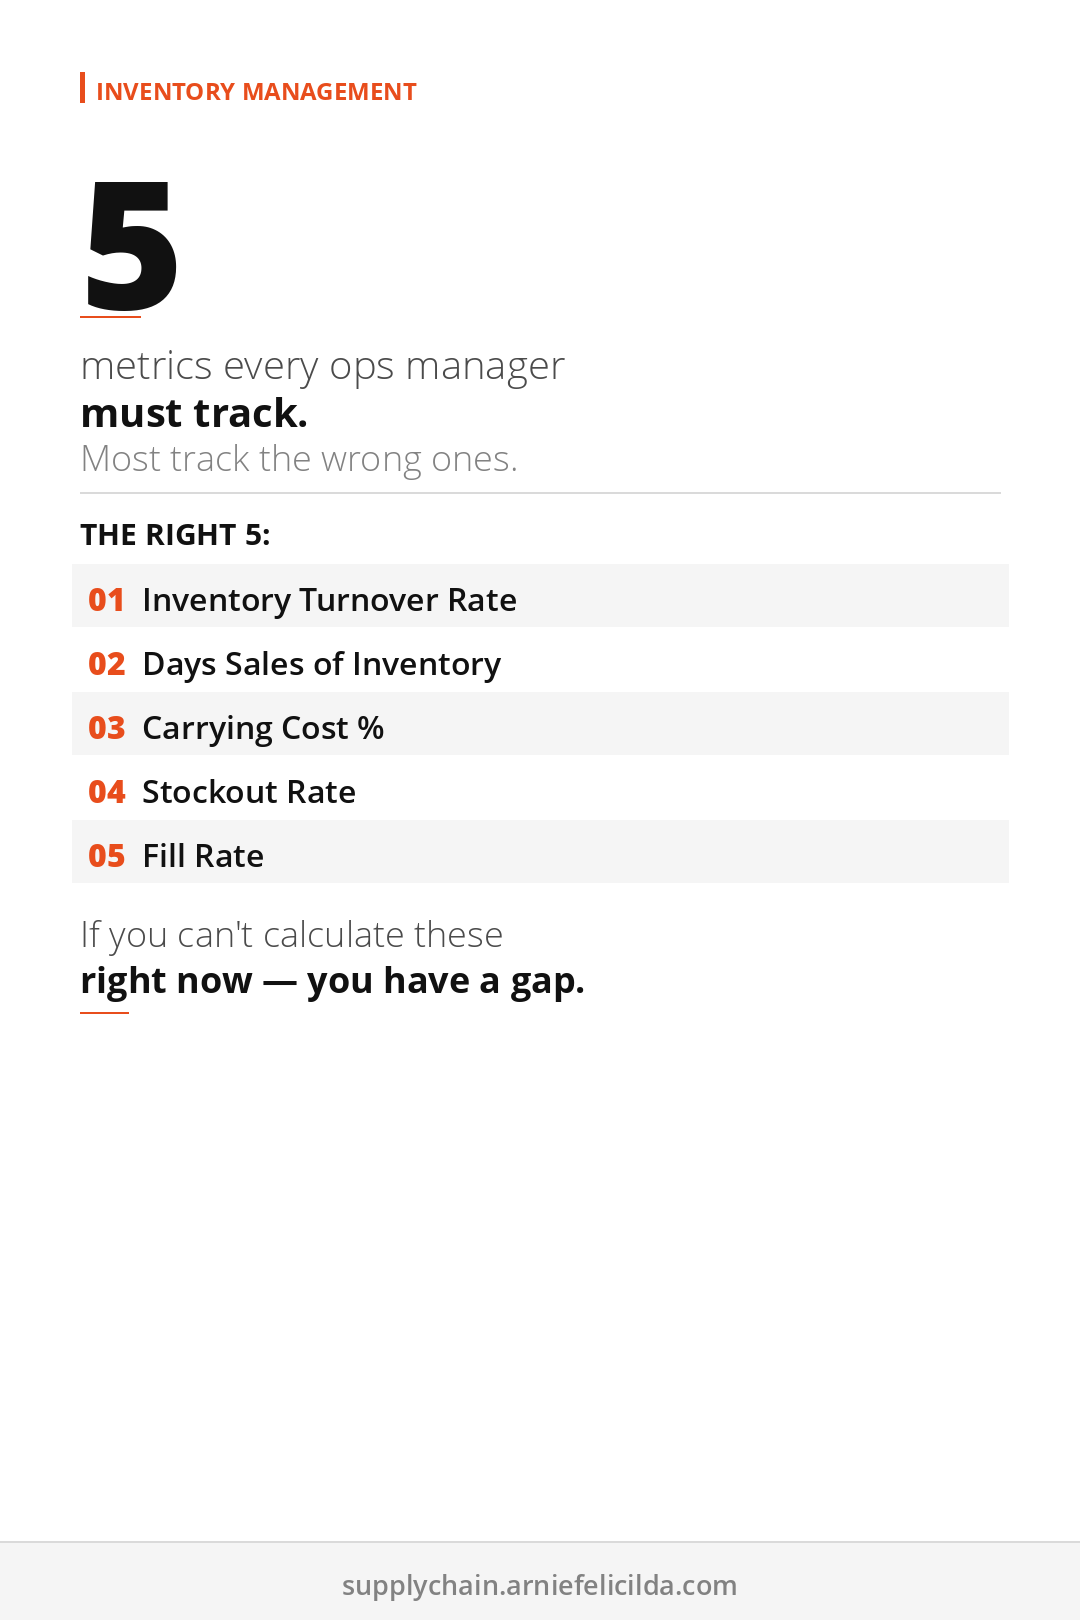
These five metrics give you the full picture. One number tells part of the story. All five together tell you what to fix and where to start.
Why Inventory Metrics Matter More Than Inventory Count
Knowing how many units you have is not inventory management. It is counting.
Real inventory management means understanding the health of what you are holding. Is it moving? Is it costing more to hold than it earns? Do you have the right amount at the right time? These five inventory metrics answer those questions directly.
One rule before you start: If you cannot calculate these five numbers from your current data right now, your inventory system has a gap. Fix the data first. The metrics follow.
The 5 Inventory Metrics Every Ops Manager Must Track
Metric 01
Inventory Turnover Rate
Inventory turnover tells you how many times you sell through and replace your inventory in a given period. High turnover means stock is moving. Low turnover means cash is sitting on shelves.
Retail typically targets 4 to 6 turns per year. Fast-moving consumer goods aim for 12 or higher. If you do not know your number, you cannot tell whether your inventory is performing or bleeding.
Formula: Cost of Goods Sold divided by Average Inventory Value
Metric 02
Days Sales of Inventory
DSI tells you how many days it takes to sell your current inventory. It is the clearest measure of how long your cash stays locked up in stock. A DSI of 30 means you turn over inventory every month. A DSI of 90 means your money sits for three months before it comes back.
For most small and mid-size operations, a DSI above 60 is a warning sign. Above 90 is a cash flow problem that compounds quietly until it becomes critical.
Formula: (Average Inventory divided by COGS) multiplied by Number of Days
Metric 03
Inventory Carrying Cost
This is the metric most ops managers skip. It is also the most expensive blind spot in inventory management. Carrying cost includes storage, insurance, obsolescence, spoilage, and the opportunity cost of capital tied up in stock.
Industry average carrying cost runs between 20 and 30 percent of total inventory value per year. On a $100,000 inventory, that is $20,000 to $30,000 annually just to hold it. Most managers never see this number because it is spread across multiple line items.
Formula: (Storage + Insurance + Obsolescence + Capital Cost) divided by Total Inventory Value, multiplied by 100
Metric 04
Stockout Rate
Stockout rate measures how often a customer or production line requests an item that is not available. Every stockout carries a direct cost: lost sales, emergency procurement, expedited freight, or production downtime.
Track stockouts by SKU category, not just total count. A single high-velocity SKU running out repeatedly is a bigger problem than ten slow-moving SKUs occasionally going to zero.
Formula: (Stockout Incidents divided by Total Order Requests) multiplied by 100
Metric 05
Fill Rate
Fill rate is the percentage of orders you fulfill completely from available stock without backorders or delays. It is the positive counterpart to stockout rate. Instead of measuring failure, it measures your ability to meet demand on time.
A 95 percent fill rate sounds strong until you realize the 5 percent you are missing might be your top revenue SKUs. Always analyze fill rate by SKU tier, not just the overall average.
Formula: (Orders Fulfilled On Time and In Full divided by Total Orders) multiplied by 100
How These 5 Inventory Metrics Work Together
These metrics do not work in isolation. Inventory turnover tells you if stock is moving. DSI tells you how long it sits. Carrying cost tells you what sitting costs. Stockout rate tells you where the gaps are. Fill rate tells you how reliably you close those gaps.
Run all five on a weekly or monthly basis. A simple spreadsheet works. Track trends over time, not just single snapshots. Low turnover combined with high carrying cost means you are overstocked on slow-moving items. High fill rate with a high stockout rate means some SKUs are masking others. Each combination points to a different fix.
Use the free Inventory Health Calculator to run all five metrics at once. Enter your numbers and get your score in under five minutes.
What to Do With the Numbers
Tracking is not the end goal. Action is. Once you have your five numbers, here is how to read them:
- Low turnover plus high DSI: You are ordering too much or too infrequently. Review reorder quantities. Consider cutting the bottom 20 percent of your catalog by velocity.
- High carrying cost: Run an ABC analysis on your SKUs to find which items occupy space and capital without justifying it.
- High stockout rate: Your reorder points are set wrong. Most stockouts happen because reorder triggers were set when demand was lower and never updated.
- Low fill rate on specific SKUs: Those SKUs need their own safety stock calculation. A blanket safety stock rule applied across all items creates both stockouts and overstock.
Inventory management is not about the most sophisticated system. It is about tracking the right numbers consistently and acting on what they tell you. Start with turnover and DSI. Add carrying cost in the first week. Track stockout rate and fill rate from month one. Within 90 days, you will have more clarity on your inventory than most managers build in a year.
Also on Pinterest: 📌 5 Inventory Metrics Every Ops Manager Must Track
From the Author
The Accidental Project Manager
How to deliver projects on time without a PMP and cut waste by 11.4% using AI workflows. 15-Minute Daily Sprint System, Scope Lock Framework, and 24 AI Prompts included.
Get the Book →More Supply Chain Reads
- You Don't Know Your True Inventory Cost (And It's Draining Your Cash)
- Why the Cheapest Supplier Is the Most Expensive Decision
Free Supply Chain Tools
Get free supply chain tools. calculators, scorecards, and frameworks.
Built for supply chain managers running inventory, suppliers, and logistics without a manual.