There are dozens of inventory KPIs you could track. Most of them are noise. The five inventory KPIs that actually matter are the ones that connect directly to cash flow, operational performance, and your ability to fulfill demand without waste.
This is for the operations manager who was handed inventory responsibility without formal supply chain training. These are the only numbers you need to start with. Everything else comes after these five are running cleanly.
The Problem With Tracking Too Many Inventory KPIs
When you track everything, you act on nothing. Inventory dashboards with 20 metrics are common. Ops managers who actually use those metrics to make weekly decisions are rare.
The goal is not the most complete dashboard. The goal is five numbers that tell you what is wrong, where it is wrong, and what to fix first.
Start here: If you cannot calculate these five KPIs from your current data, your first job is not to track more. It is to fix your data capture. You cannot manage what you cannot measure.
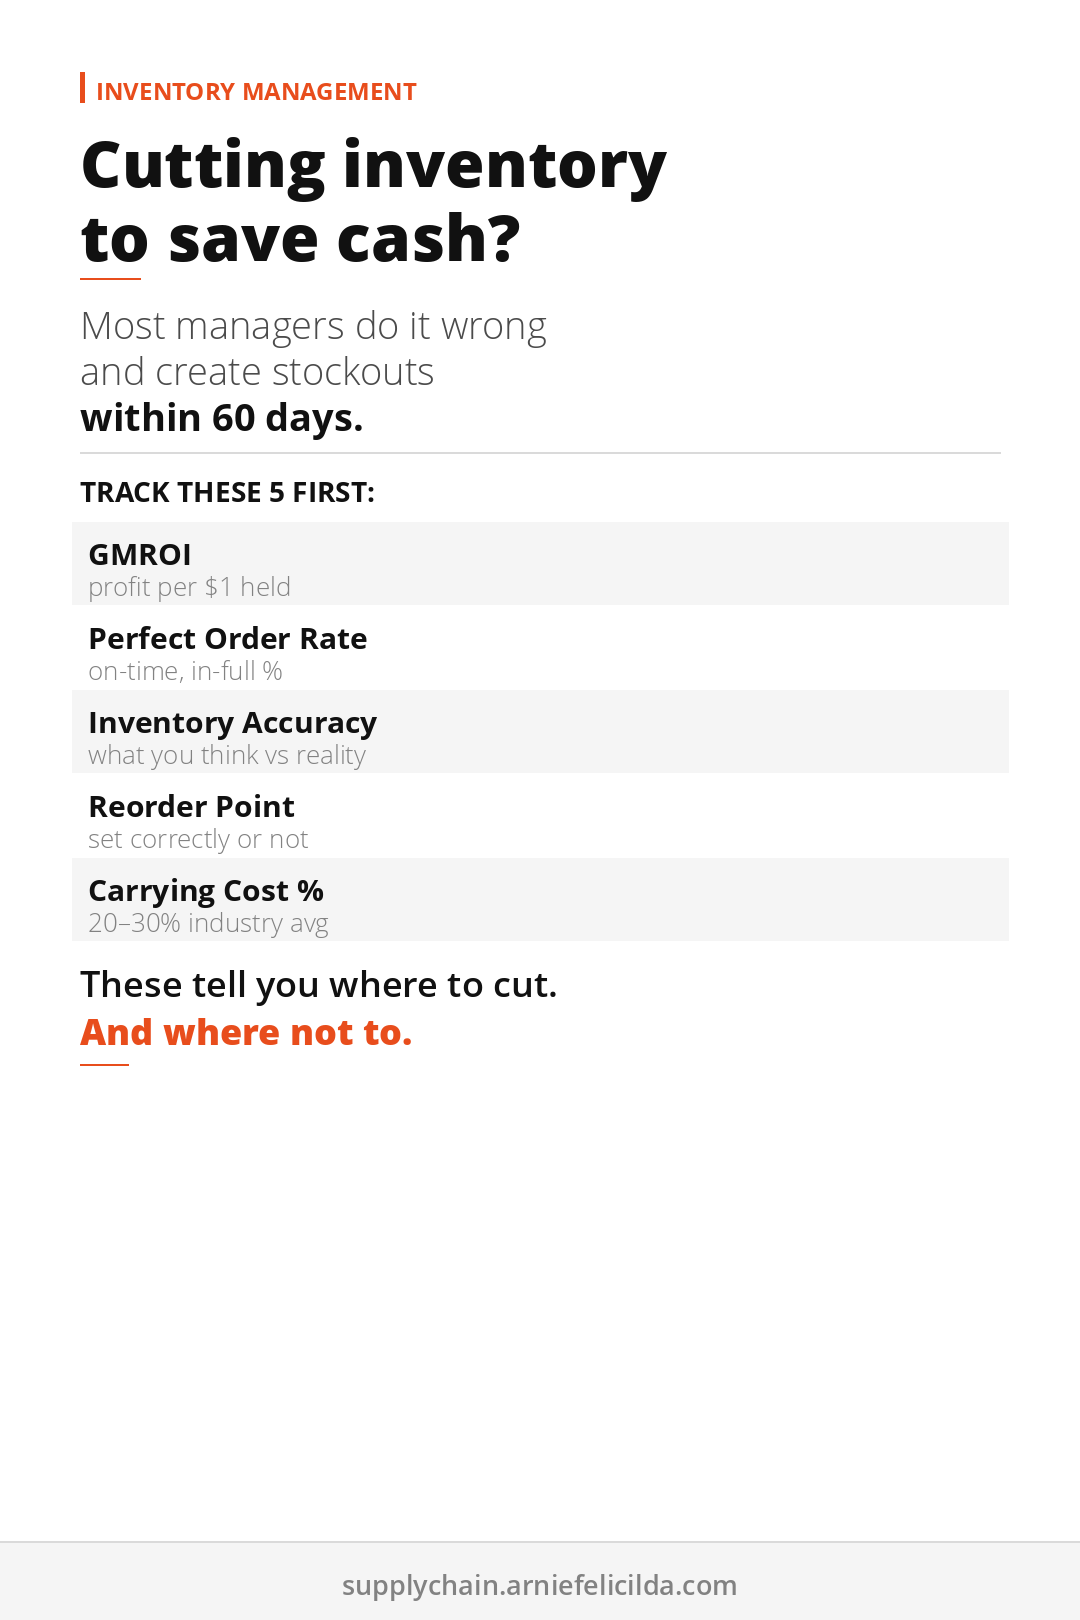
The 5 Inventory KPIs That Actually Matter
KPI 01
Gross Margin Return on Inventory Investment (GMROI)
GMROI tells you how much gross profit you earn for every dollar invested in inventory. A GMROI above 1.0 means you are making more than you are spending to hold it. Below 1.0 means you are losing money on that inventory position.
This is the single most important profitability metric for inventory. It combines margin and turnover into one number. A high-margin, slow-moving item can have the same GMROI as a low-margin, fast-moving item. Both can be equally problematic depending on your cash position.
Formula: Gross Profit divided by Average Inventory Cost
KPI 02
Perfect Order Rate
Perfect order rate measures the percentage of orders delivered on time, in full, damage-free, and with accurate documentation. It is the most complete measure of your supply chain's output quality. An order that arrives late, short, or damaged is not a perfect order, even if it eventually gets resolved.
Most operations target 95 percent or higher. Below 90 percent is a systemic problem, not a one-off issue.
Formula: (Perfect Orders divided by Total Orders) multiplied by 100
KPI 03
Inventory Accuracy Rate
Inventory accuracy measures how closely your recorded inventory matches your physical inventory. Discrepancies happen through shrinkage, receiving errors, data entry mistakes, and system lag. An accuracy rate below 95 percent makes every other inventory decision unreliable.
If you have never formally measured this, assume it is lower than you think. Most operations that measure for the first time find rates between 75 and 85 percent.
Formula: (Accurate SKU Count divided by Total SKU Count) multiplied by 100
KPI 04
Reorder Point Accuracy
Reorder point accuracy measures how well your reorder triggers match actual demand. If your reorder points were set six months ago and demand has shifted, you are either ordering too early and building excess stock or ordering too late and causing stockouts.
Review reorder points quarterly at minimum. For seasonal products, review before every peak period. This single adjustment prevents more stockouts than any other operational change.
Formula: Reorder Point = (Average Daily Demand multiplied by Lead Time) + Safety Stock
KPI 05
Carrying Cost as Percentage of Inventory Value
Most operations managers know their purchase cost. Almost none track carrying cost as a percentage of total inventory value. This number, typically 20 to 30 percent annually, is the invisible drain on working capital that only shows up when cash flow gets tight.
Use the free Inventory Health Calculator to find your carrying cost percentage in under five minutes.
Formula: Total Annual Carrying Costs divided by Average Inventory Value, multiplied by 100
How to Start Tracking These KPIs Today
You do not need new software. You need consistent data and a simple tracking habit. Export your sales and inventory data weekly. Calculate all five KPIs in a spreadsheet on the same day each week. Track trends over four weeks before making any major decisions. Set a threshold for each KPI so you know in advance what number triggers a review.
Consistency matters more than precision in the early stages. A rough number tracked weekly beats a perfect number calculated once a quarter.
Of the five, reorder point accuracy is the leading indicator. The other four measure what has already happened. Reorder point accuracy tells you what is about to happen. If you only have time for one KPI this week, check your reorder points on your five highest-velocity SKUs. In most cases, at least two will need adjustment.
For a deeper look at the cost side, read You Don't Know Your True Inventory Cost. It walks through the full cost breakdown most managers miss.
Five KPIs. Tracked consistently. Acted on weekly. That is the entire system.
Also on Pinterest: 📌 5 Inventory KPIs That Actually Matter — Track These, Ignore the Rest

From the Author
The Accidental Project Manager
How to deliver projects on time without a PMP and cut waste by 11.4% using AI workflows. 15-Minute Daily Sprint System, Scope Lock Framework, and 24 AI Prompts included.
Get the Book →More Supply Chain Reads
- You Don't Know Your True Inventory Cost (And It's Draining Your Cash)
- Why the Cheapest Supplier Is the Most Expensive Decision
Free Supply Chain Tools
Get free supply chain tools. calculators, scorecards, and frameworks.
Built for supply chain managers running inventory, suppliers, and logistics without a manual.