ABC analysis is the fastest way to find out which inventory items deserve your time and which ones are wasting it. It takes 10 minutes with your current sales data. It tells you exactly where 70 to 80 percent of your revenue comes from and which SKUs you are spending resources on that do not justify the attention.
If you manage more than 20 SKUs and you do not have an ABC classification, you are applying the same level of effort to your worst-performing products as your best. That is not efficiency. It is equal treatment of unequal things.
What ABC Analysis Is and Why It Works
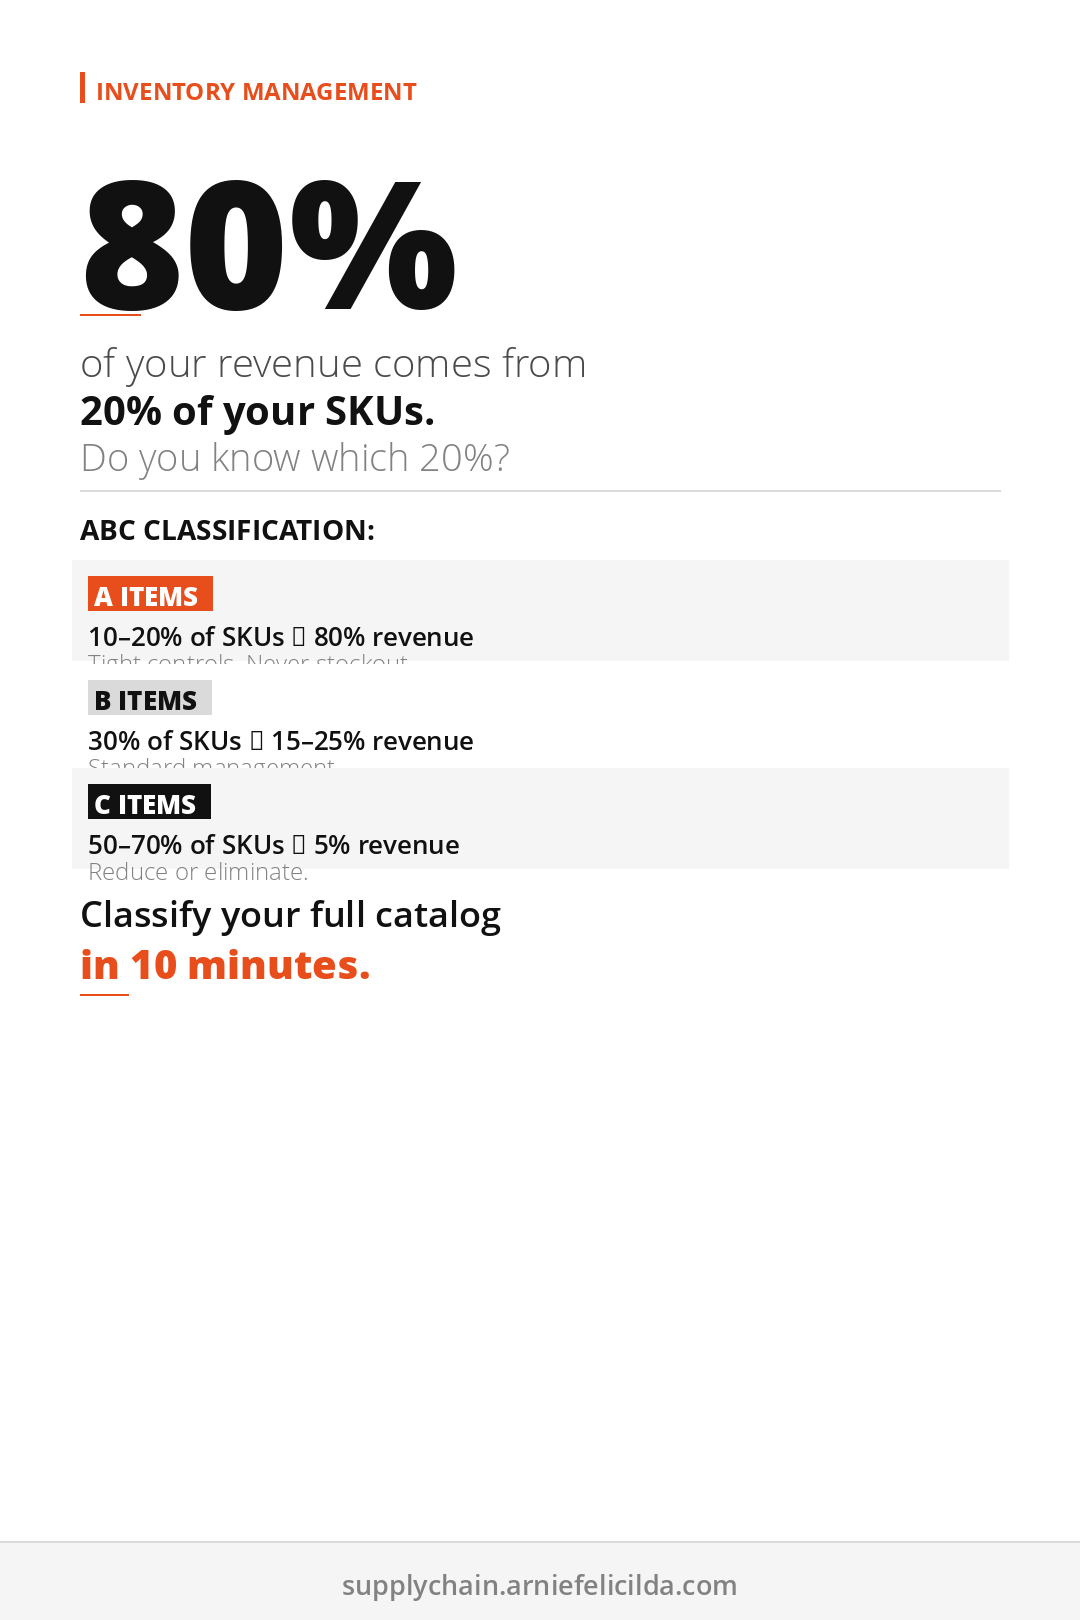
ABC analysis is a categorization method based on the Pareto principle: roughly 20 percent of items account for 80 percent of results. In inventory management, that means a small number of your SKUs are responsible for the majority of your revenue, profit, or stock movement.
| Class | % of SKUs | % of Revenue | Management Approach |
|---|---|---|---|
| A Items | 10-20% | 70-80% | Tight controls. Weekly counts. Never stockout. |
| B Items | 30% | 15-25% | Moderate controls. Monthly review. Standard reorder. |
| C Items | 50-70% | 5-10% | Minimal controls. Quarterly review. Reduce or eliminate. |
A items are your business-critical SKUs. They drive almost all of your revenue. A stockout on an A item is a revenue event. C items are the long tail. They exist in your catalog, take up space, and most of them are not worth the inventory investment they require.
How to Run an ABC Analysis in 10 Minutes
Step 1: Export Your Sales Data
Pull the last 12 months of sales by SKU from your POS, ERP, or inventory system. You need two columns: SKU name and total annual revenue or units sold.
Step 2: Sort by Revenue, Highest to Lowest
Sort your full SKU list from the highest revenue contributor to the lowest. Do not filter. Do not group. Just sort the complete list.
Step 3: Calculate Cumulative Percentage
Add a column for cumulative revenue percentage. Calculate what percentage of total revenue each SKU represents, then add a running total. The SKUs that take you from 0 to 80 percent of cumulative revenue are your A items.
Step 4: Draw the Lines
- A items: SKUs that account for the first 80 percent of cumulative revenue
- B items: SKUs from 80 to 95 percent of cumulative revenue
- C items: Everything remaining, the bottom 5 percent of revenue contribution
Most operations find their A items are a surprisingly small list. If you have 200 SKUs, your A list might be 15 to 25 items. Those 25 items are your business. Everything else is supporting cast.
What to Do With Your ABC Classification
For A Items
Weekly cycle counts. Reorder points reviewed monthly. Safety stock calculated precisely. No guessing on lead times. A stockout on an A item is not acceptable. Build your entire inventory system around protecting these SKUs first.
For B Items
Standard reorder point management. Monthly review. Safety stock based on average demand variability. These items do not need special attention unless they show signs of moving toward A status, which you should monitor quarterly.
For C Items
This is where most operations leave money on the table. C items accumulate. They get reordered out of habit. Review your C list quarterly and ask three questions for each item: Is it still selling? Is the margin worth the carrying cost? Would a customer notice if you stopped stocking it? Items that fail all three should be discontinued or liquidated.
Common Mistakes in ABC Analysis
- Using units instead of revenue: A high-volume, low-price item may look like an A item by units but is a C item by revenue impact. Use revenue or gross margin as your primary sort.
- Never updating the classification: Your A items this year may not be your A items next year. Run ABC quarterly or at minimum annually.
- Ignoring B items: B items are the ones that move up or down. A B item trending toward A needs attention now, before it becomes critical.
- Keeping all C items: The goal of identifying C items is to act on them. If your C list never shrinks, the analysis is not working.
ABC analysis is not complex. It is a sorted list with lines drawn at 80 and 95 percent of cumulative revenue. What makes it powerful is the differentiated management approach that follows. Focus your best attention on the items that deserve it most. Use the free Inventory Health Calculator to combine ABC data with carrying cost and turnover metrics in one view.
Also on Pinterest: 📌 ABC Analysis — Find Where Your Money Actually Is
From the Author
The Accidental Project Manager
How to deliver projects on time without a PMP and cut waste by 11.4% using AI workflows. 15-Minute Daily Sprint System, Scope Lock Framework, and 24 AI Prompts included.
Get the Book →More Supply Chain Reads
- You Don't Know Your True Inventory Cost (And It's Draining Your Cash)
- Why the Cheapest Supplier Is the Most Expensive Decision
Free Supply Chain Tools
Get free supply chain tools. calculators, scorecards, and frameworks.
Built for supply chain managers running inventory, suppliers, and logistics without a manual.