Every SKU in your inventory is not equal. Some drive the majority of your revenue and deserve your tightest controls. Others barely move and are quietly consuming storage space, capital, and management attention that would be better directed elsewhere. SKU classification tells you which is which. In 10 minutes. Using data you already have.
The method is called ABC analysis. It is the most practical inventory prioritization tool available to operations managers, and it requires nothing more than a spreadsheet and your last 12 months of sales data.
Why SKU Classification Changes Everything
Without classification, most operations managers apply equal attention to unequal problems. They reorder every SKU on the same cycle. They count all SKUs with the same frequency. They negotiate with suppliers for all products using the same urgency. The result is that critical SKUs receive the same treatment as insignificant ones. Your best items are under-managed and your worst items are over-resourced.
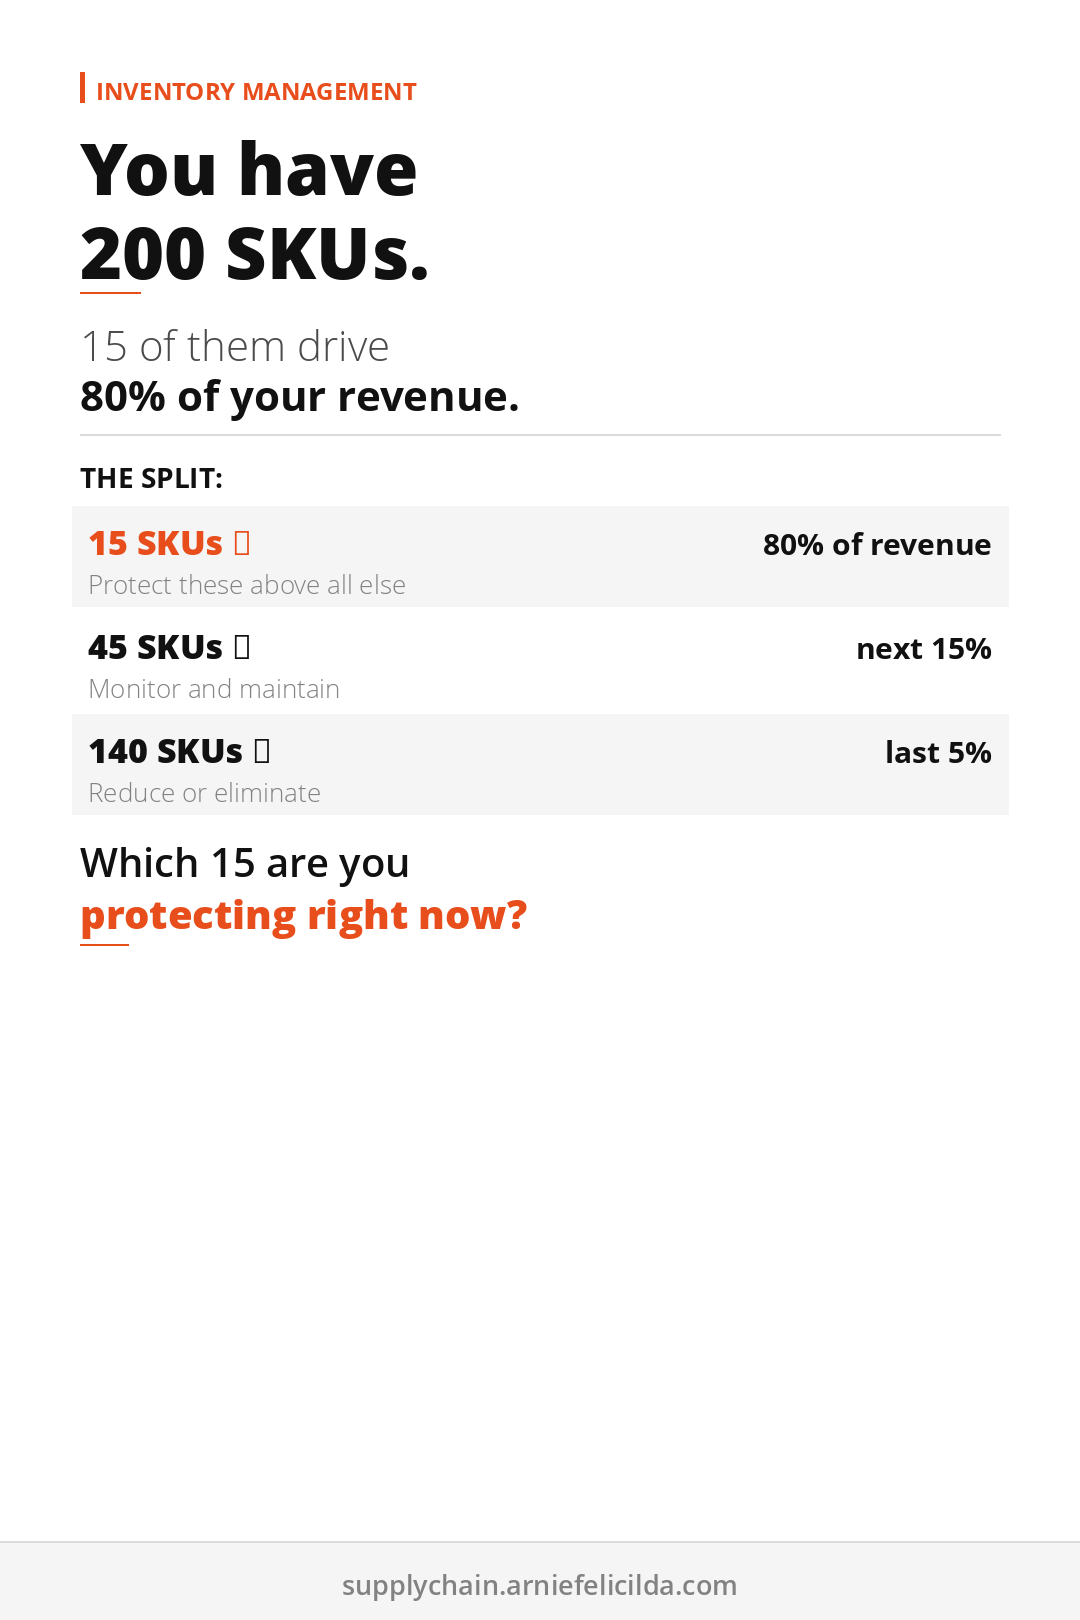
ABC classification fixes this by creating three tiers of differentiated management. A items get intensive management. B items get standard management. C items get minimal management or get eliminated.
In most operations, 10 to 20 percent of SKUs generate 70 to 80 percent of revenue. Those are your A items. They are your business. Every operational decision should protect them first.
How to Classify Your SKUs in 10 Minutes
Export 12 months of sales by SKU
Pull total annual revenue or units sold per SKU from your POS, ERP, or inventory system. You need two columns: SKU identifier and annual revenue contribution.
Sort highest to lowest by revenue
Sort your entire SKU list from the highest revenue contributor to the lowest. Do not filter or group. Sort the full list.
Add a cumulative percentage column
Calculate what percentage of total annual revenue each SKU represents. Then add a running cumulative total. The first SKU might represent 8 percent of total revenue. The second adds another 6 percent, bringing the cumulative to 14 percent. Continue down the list.
Draw the lines
Mark the point where cumulative revenue hits 80 percent. Everything above that line is an A item. SKUs from 80 to 95 percent are B items. Everything from 95 to 100 percent is a C item.
Apply differentiated management rules
A items: weekly cycle counts, monthly reorder point review, dedicated safety stock calculation. B items: monthly counts, quarterly reorder review, standard safety stock. C items: quarterly counts, annual review, evaluate for discontinuation.
What to Do With Your C Items
C items are where most inventory waste lives. They accumulate because no one actively manages them down. They get reordered out of habit. They sit on shelves consuming carrying cost that is rarely justified by the revenue they generate.
For each C item, ask three questions: Has this item sold in the past 90 days? Is the gross margin above your minimum threshold after carrying cost is included? Would a customer notice or go elsewhere if you stopped stocking it?
Items that fail all three should be discontinued or liquidated. The carrying cost recovery from clearing slow-moving C items is often the fastest cash flow improvement available to an operations manager without a capital investment.
Combining ABC With Demand Volatility
Standard ABC analysis ranks by revenue. A more sophisticated version combines revenue rank with demand volatility to create an XYZ classification. X items have stable, predictable demand. Y items have moderate variability. Z items have highly variable or irregular demand.
An A-Z item, high revenue and highly variable demand, is your most complex inventory management challenge. It needs the tightest controls and the most deliberate safety stock calculation. Start with standard ABC. Add XYZ classification for your top 20 A items once the basic system is running.
Use the free Inventory Health Calculator to combine your ABC classification with carrying cost and turnover metrics in one view. Ten minutes with a spreadsheet. One sorted list. Three categories. The complexity is not in the analysis. It is in following through on what the classification tells you to do with each tier.
Also on Pinterest: 📌 Classify Your SKUs in 10 Minutes — ABC Analysis Template
From the Author
The Accidental Project Manager
How to deliver projects on time without a PMP and cut waste by 11.4% using AI workflows. 15-Minute Daily Sprint System, Scope Lock Framework, and 24 AI Prompts included.
Get the Book →More Supply Chain Reads
- You Don't Know Your True Inventory Cost (And It's Draining Your Cash)
- Why the Cheapest Supplier Is the Most Expensive Decision
Free Supply Chain Tools
Get free supply chain tools. calculators, scorecards, and frameworks.
Built for supply chain managers running inventory, suppliers, and logistics without a manual.